Manzanita Canyon 2019 - one year later!

One of the restoration plots in Manzanita Canyon in spring 2016 (L), before planting, and in spring 2019 (R), one year after the end of our Prop 1 project.
Recap
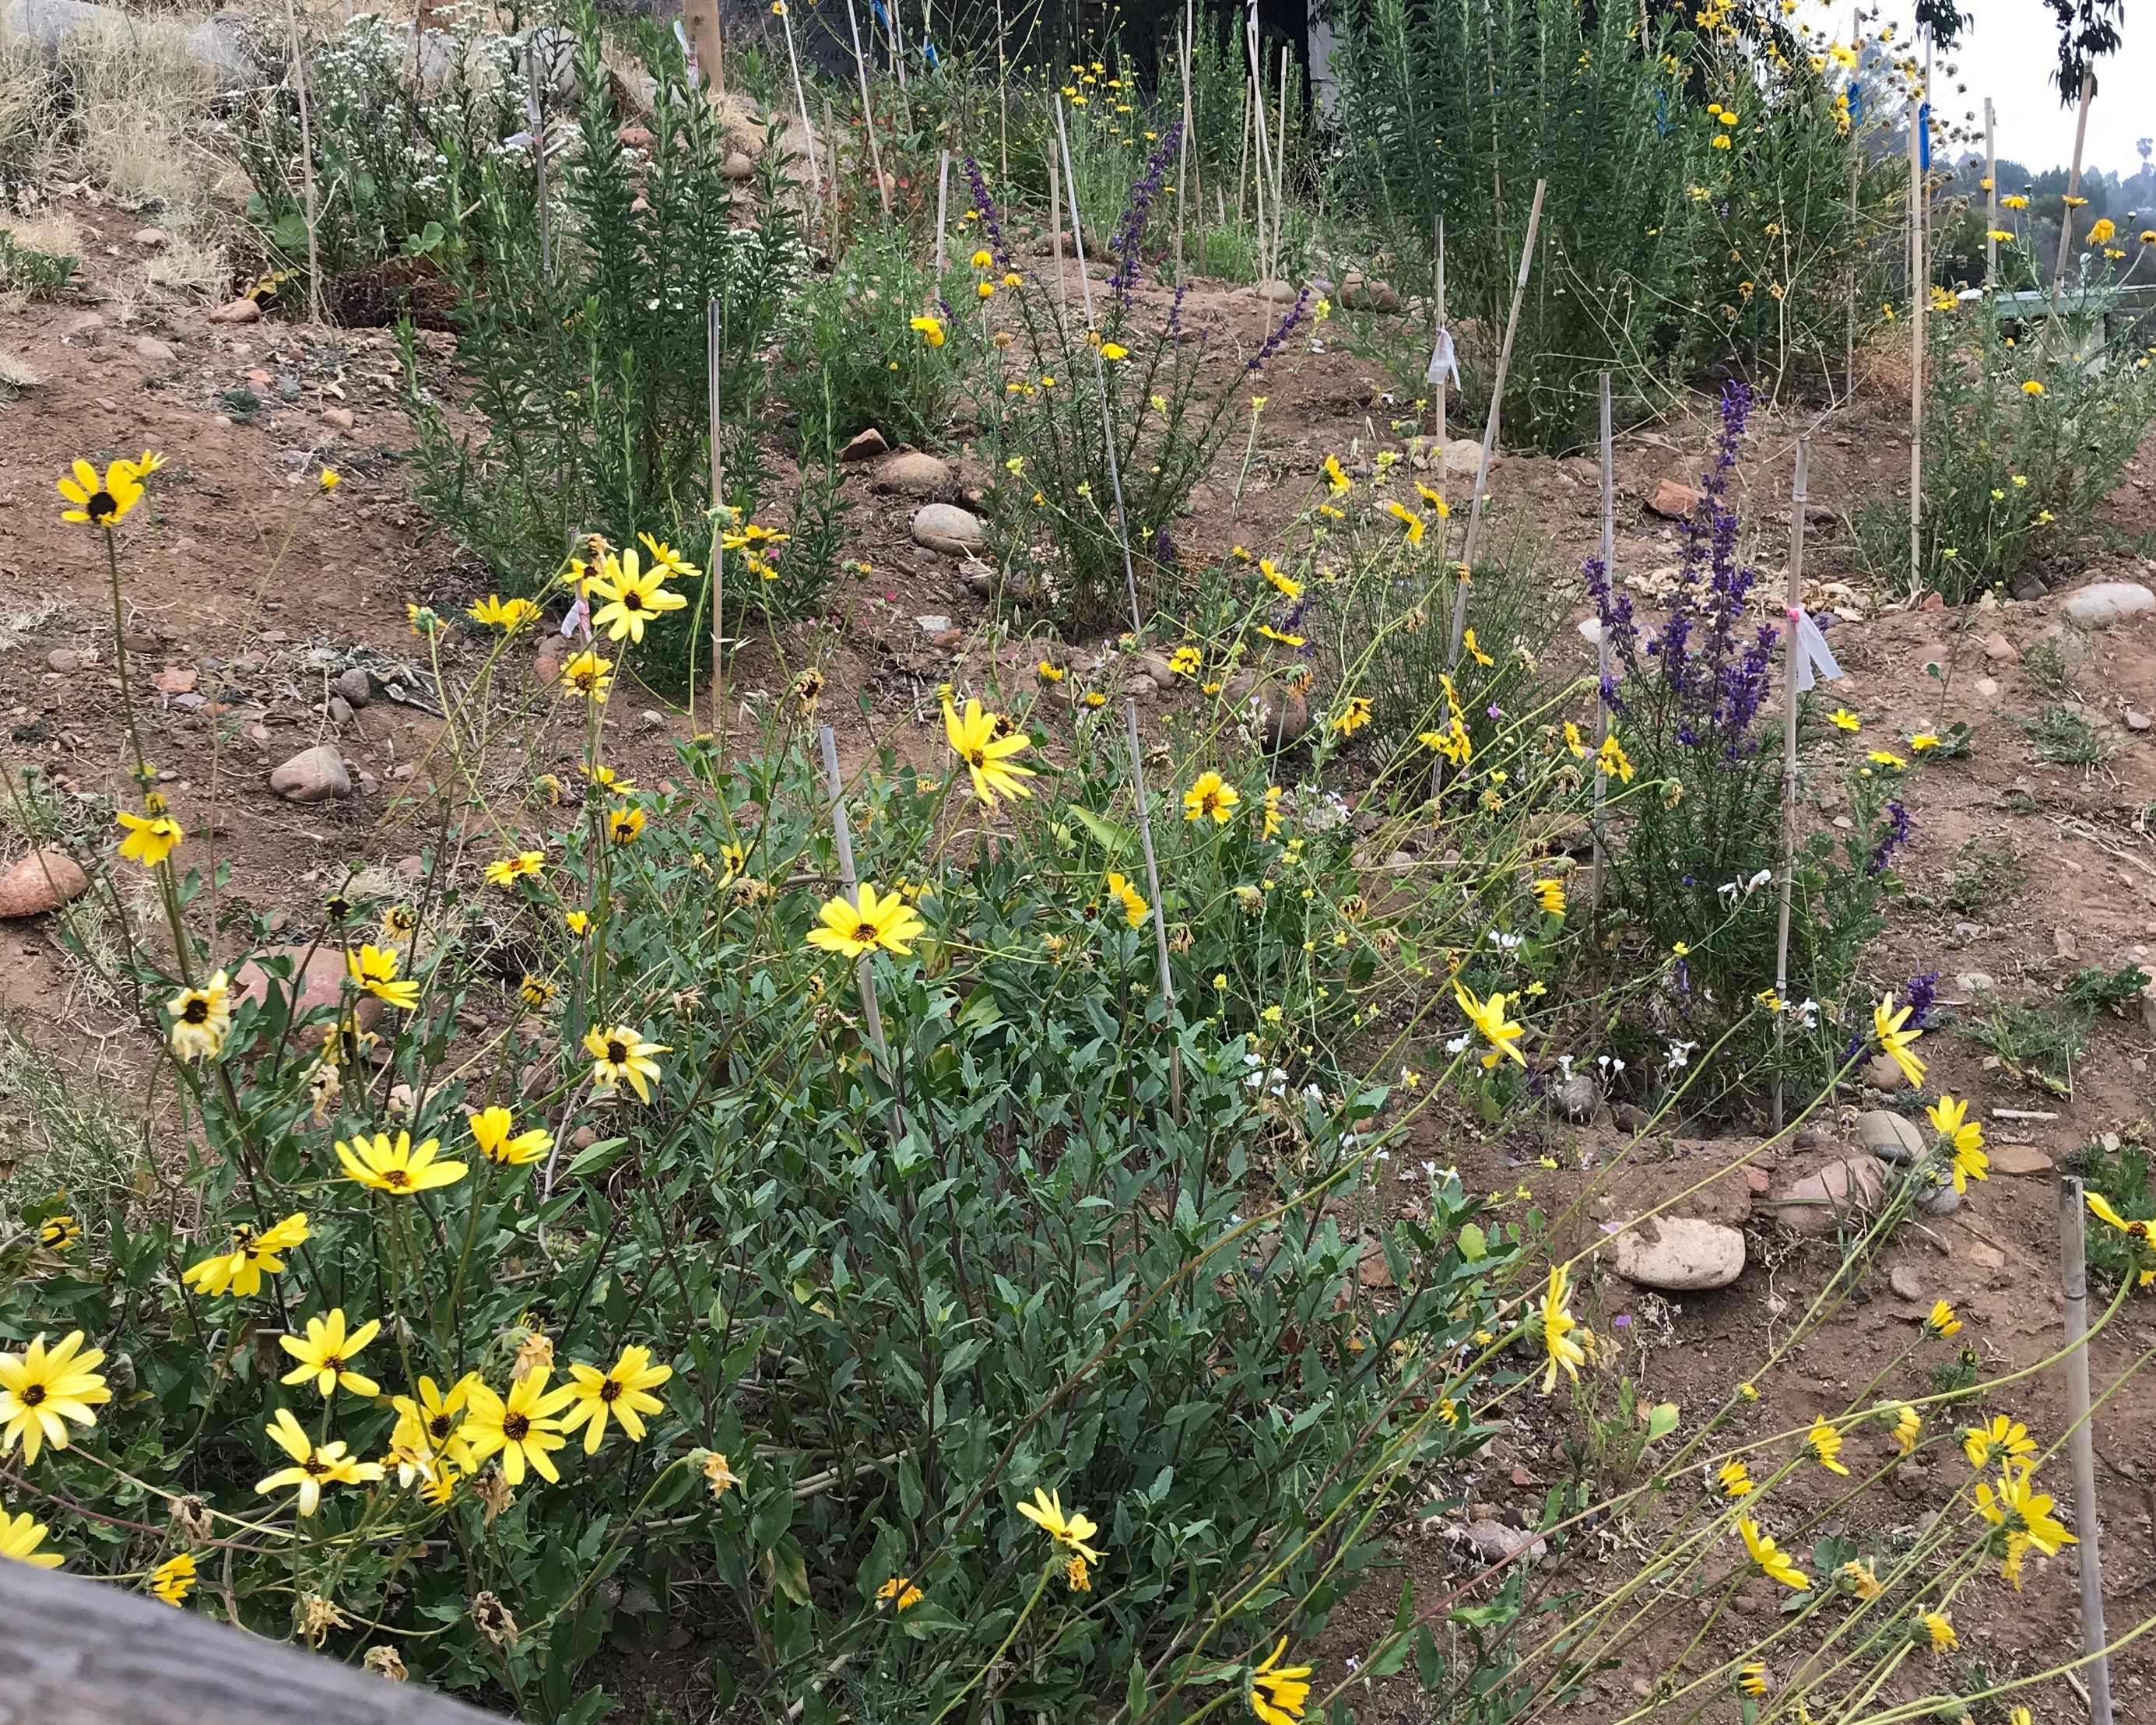
A recently planted restoration plot, spring 2018.
We checked in on some of our restoration plots in Manzanita Canyon in April 2019—one year after our Prop 1 project with San Diego Canyonlands (Fig. 1) and Ocean Discovery Institute ended. The project aimed to increase the climate resilience of an urban canyon and community through combined restoration, stewardship and science efforts. In the spring of 2016, we surveyed the plant communities of six 100m2 plots slated for restoration and six adjacent 100m2 reference plots (download plant data). Over the next two winters, native perennial shrubs were planted throughout the canyon. We sampled our 12 plots each spring to determine how restoration activities were influencing plant community structure.
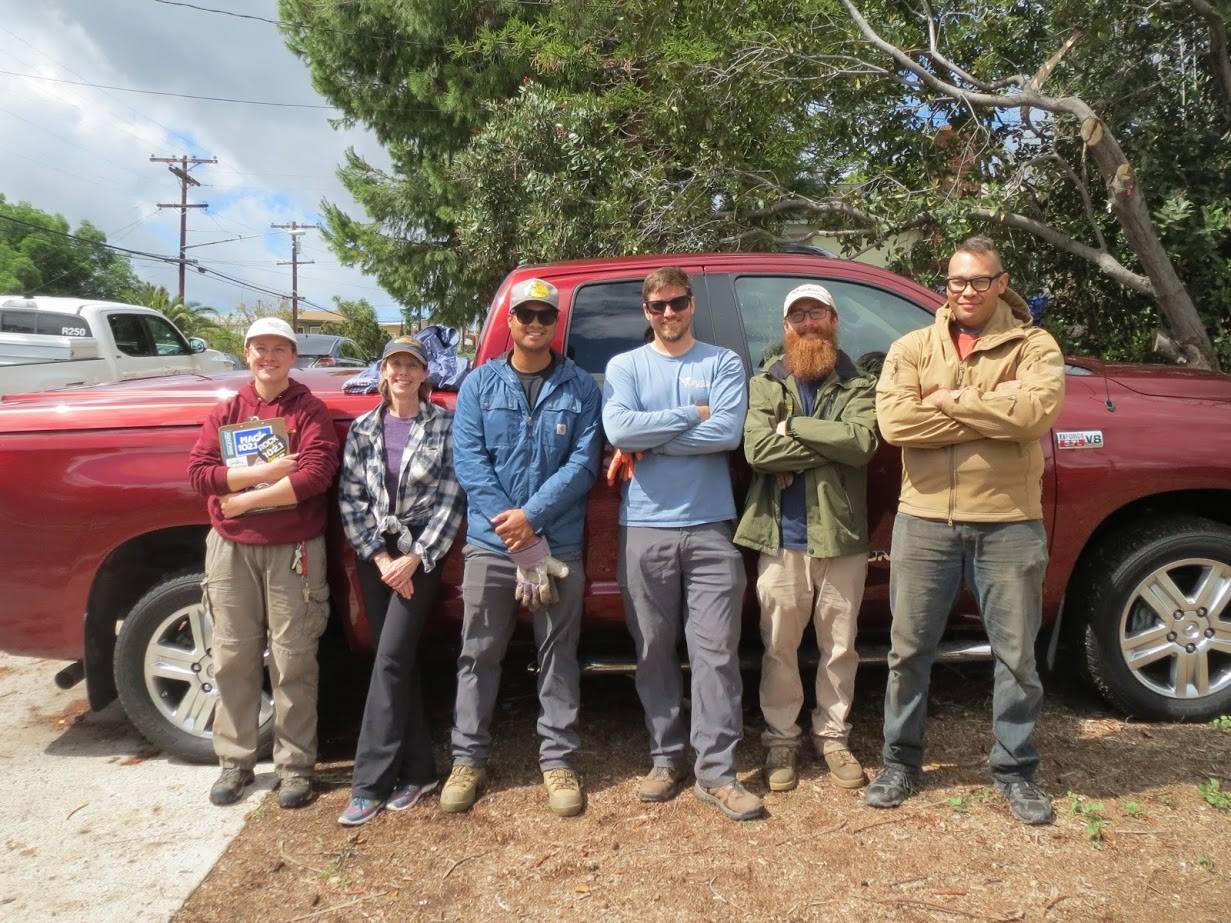
Fig. 1. The San Diego Canyonlands crew atop Manzanita Canyon, March 2018.
Our project ended in July 2018, and we concluded that native plantings were shaping community structure, but that restoration takes time—with a canyon-wide planting survival of about 50% and only 1-2 years of growth for surviving plants, our restored plant communities remained significantly different from the reference communities. Our recent post-project check-in confirmed this and revealed a couple of recommendations.
Reference plant communities
There were no significant changes in the reference plot plant communities throughout the project (P>0.88; Fig. 2) largely due to the dominance of long-lived native perennial plants (Fig. 3). These plots model what we hope to see in the restoration sites—cover of plants that are tolerant of fire and drought, and that offer year-round habitat values and other ecosystems services, such as carbon storage, erosion control, and uptake of nutrients and contaminants that may be in urban runoff.
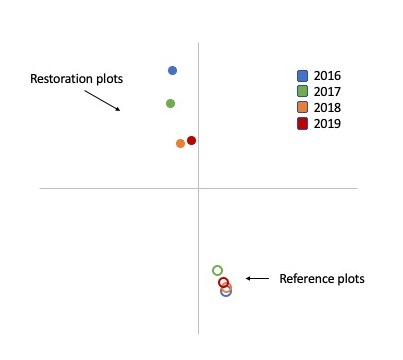
Fig. 2. nMDS of plant species abundances (%) from Manzanita Canyon restoration and reference plots. Each point is an average (n=6 plots) of the plant community MDS values. Physical distances between points correspond with differences between the abundances of all species in a community so that the farther the distance between points, the more different the plant communities are. We did not survey reference plots in 2019, shown is the average MDS value for the reference plots from 2016-2018, to facilitate comparison with 2019’s restoration plot compositions.
Restored vs. reference plant communities
Restored plant communities have become more similar to reference communities since 2016, thanks to dedicated planting efforts and growth of plantings, but the two plot types remain very distinct from one another (P<0.02; Fig. 2).
Reference communities support a greater coverage of woody natives (Fig. 3,4) such as scrub oak, laurel sumac, California lilac, desert broom, lemonade berry and black sage. Meanwhile, restored communities tend to have greater coverage of invasive annual plants (Fig. 3,4), such as black mustard, shortpod mustard and wild radish—all annuals that grow and flower quickly in winter rains and then die, spending most of the year as standing dry stalks that increase fire fuel loads.
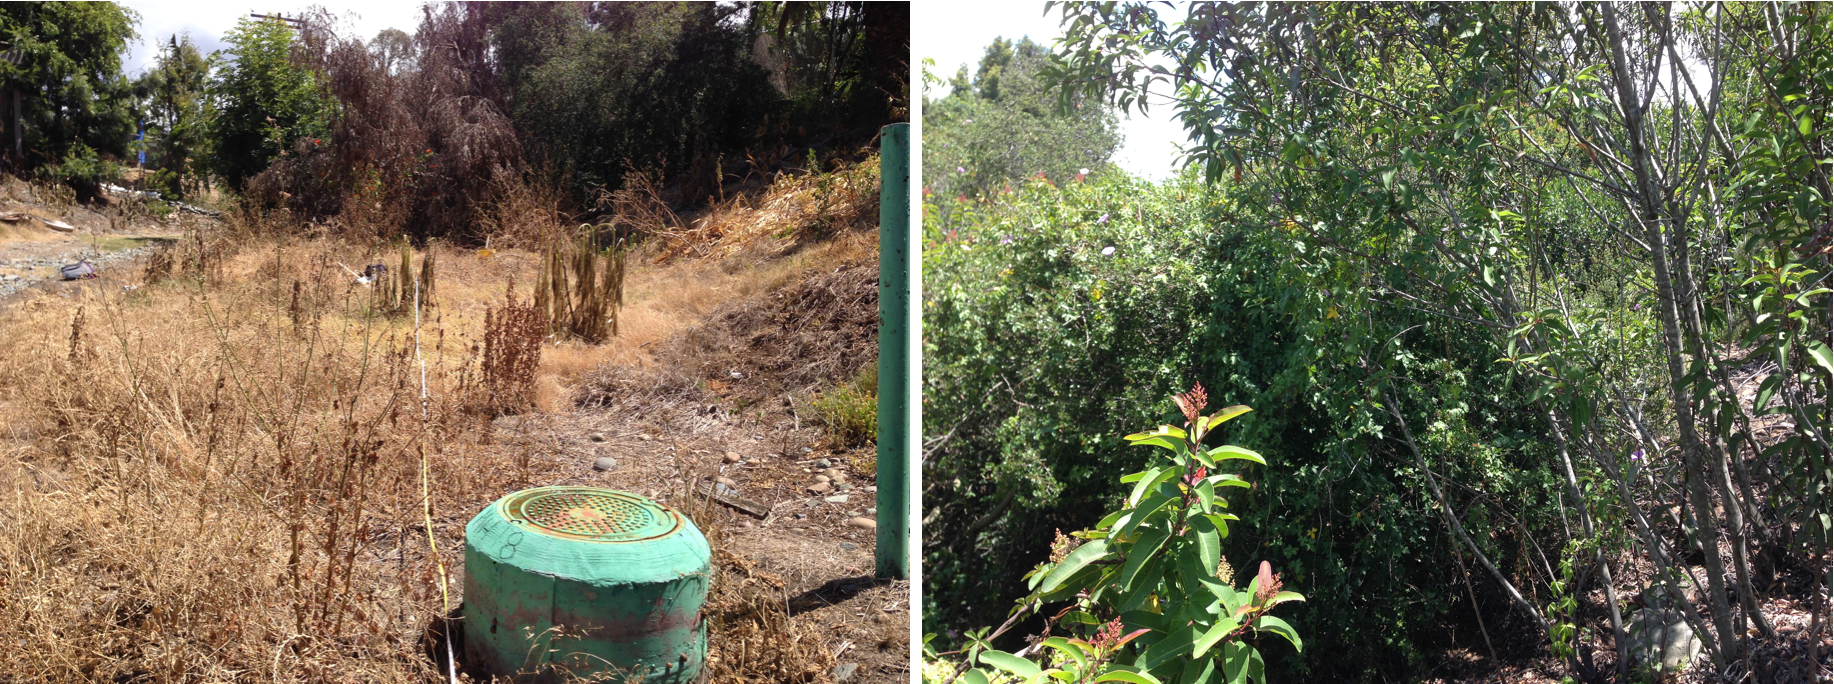
Fig. 3. Paired restoration (L) and reference (R) plots facing upstream in Manzanita Canyon in 2016. Note the dominance of invasive annual plants and disturbed ground in the restoration plot compared to the native woody perennial community in the reference plot.
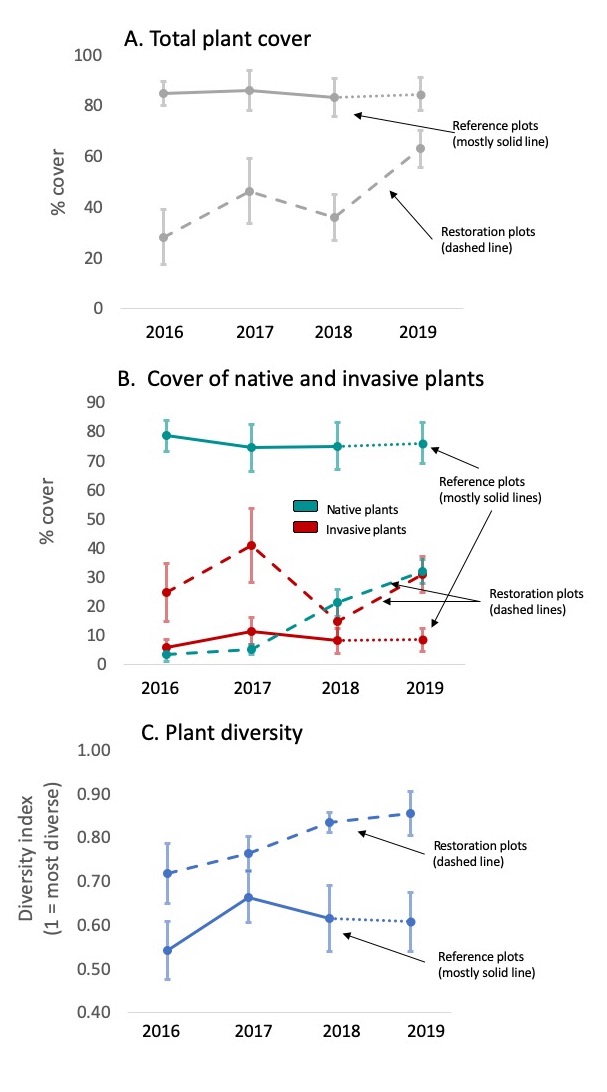
Fig. 4. Changes in plant community attributes in Manzanita Canyon restoration and reference plots from 2016-2019. Shown are changes in (A) % cover of all plants, (B) % cover of native and invasive plants, and (C) plant diversity. Diversity was calculated using Simpson’s Index of Diversity (1-D), which reflects the probability that two individuals randomly selected from a sample will belong to different species (i.e., 0 = no chance of being different, 1 = 100% chance of being different). We did not resurvey reference plots in 2019, but rather used averages of 2016, 2017, and 2018 values (see dotted segments of reference plot lines) to facilitate comparison with 2019 restoration values.
Trajectory of restored plant communities
There were neglibible changes within the restored plant communities from year to year (P>0.30), mostly due to the consistency of annual weeds each year. There was however a more obvious change when the plant community of 2016 was compared to 2019 (P=0.10) due to the addition of native plantings in 2017 and 2018, and the continued growth of surviving plantings.
Plant cover increased from when we began in 2016 and when we sampled in spring 2019, including the cover of woody native perennials (Fig. 4A,B;5), illustrating that our cumulative efforts initiated change in canyon restoration areas.
Plant diversity was always higher in restoration plots due to the wide variety of invasive annuals that grow in the more degraded areas of the canyon. Plant diversity continued to increase from 2016 to 2019, likely due to the addition of native plantings in restoration plots (Fig. 4C). Importantly, the least change in plant community structure occurred between the last year of planting (2018) and our check-in visit this year, revealing that growth and spread of natives, without human assistance, may be a much slower process (Fig. 2).
Recommendations
Our check-in revealed that continued planting and maintenance would help to drive the trajectory of restoration from disturbed to mature coastal sage scrub, and continued monitoring would be valuable to track progress and indicate when interventions are needed.
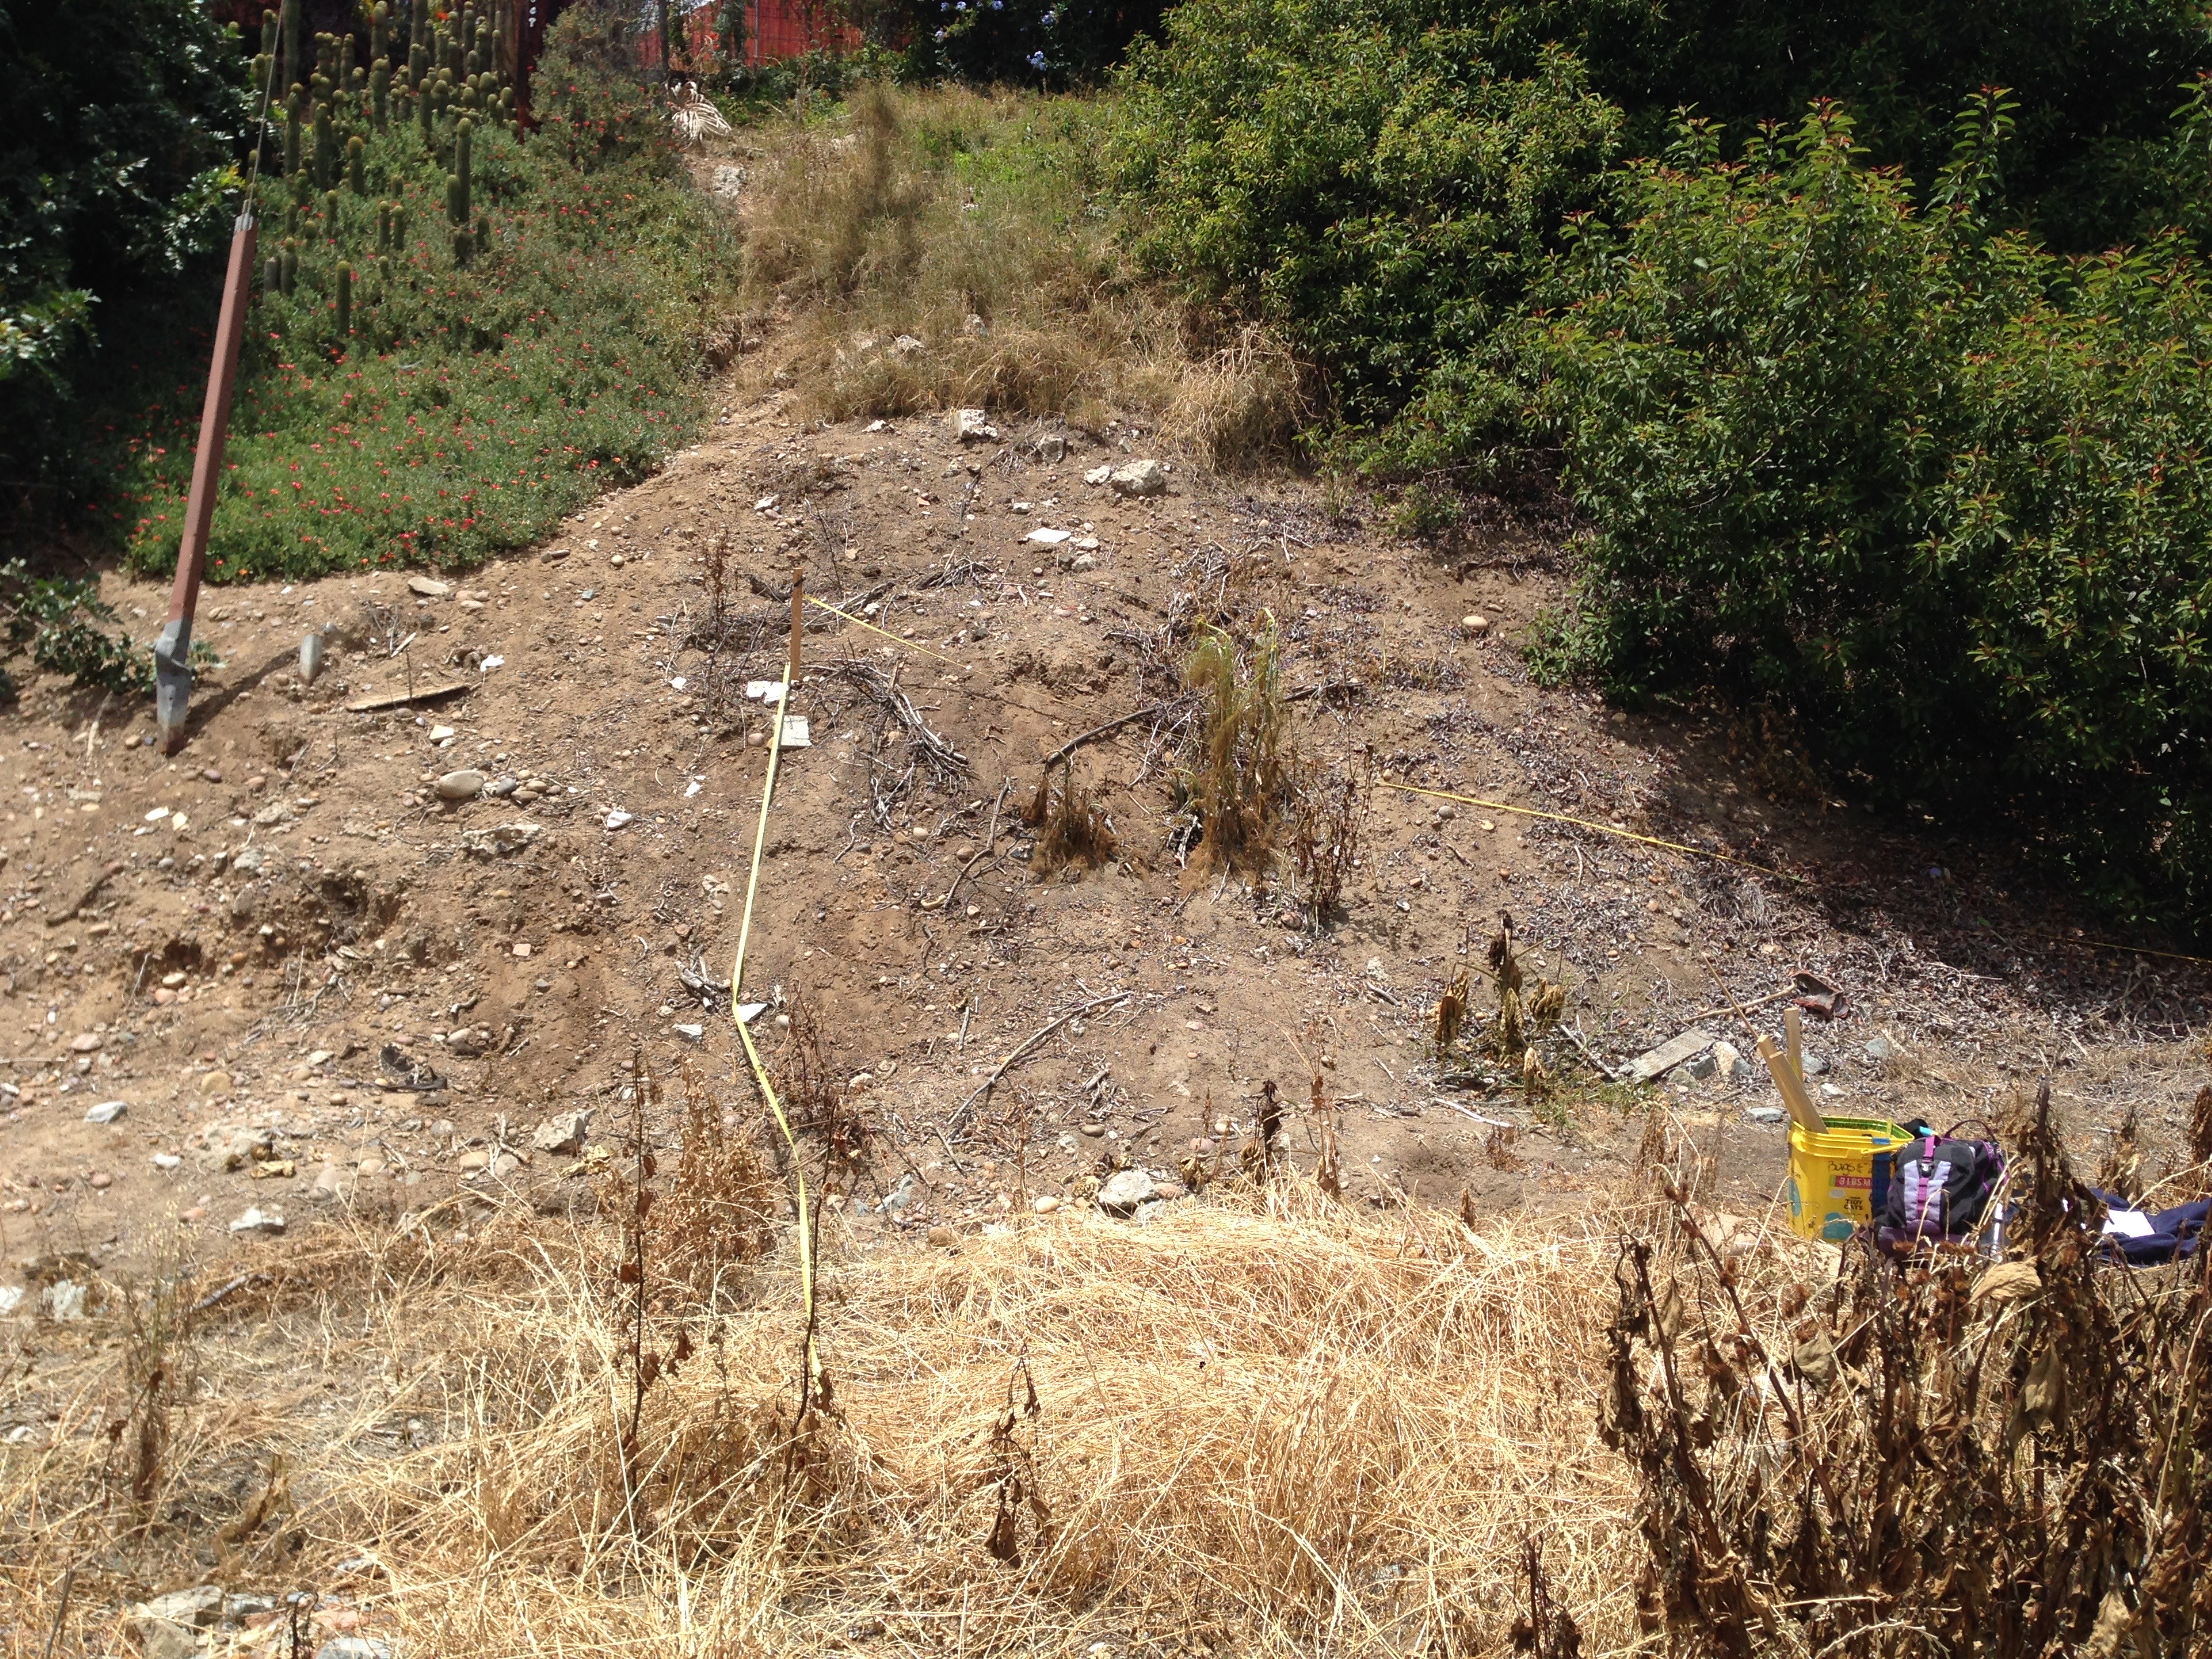
Fig. 5a. A shot of a restoration plot in Manzanita Canyon, before planting, in 2017; see below for photos documenting change in this plot through time.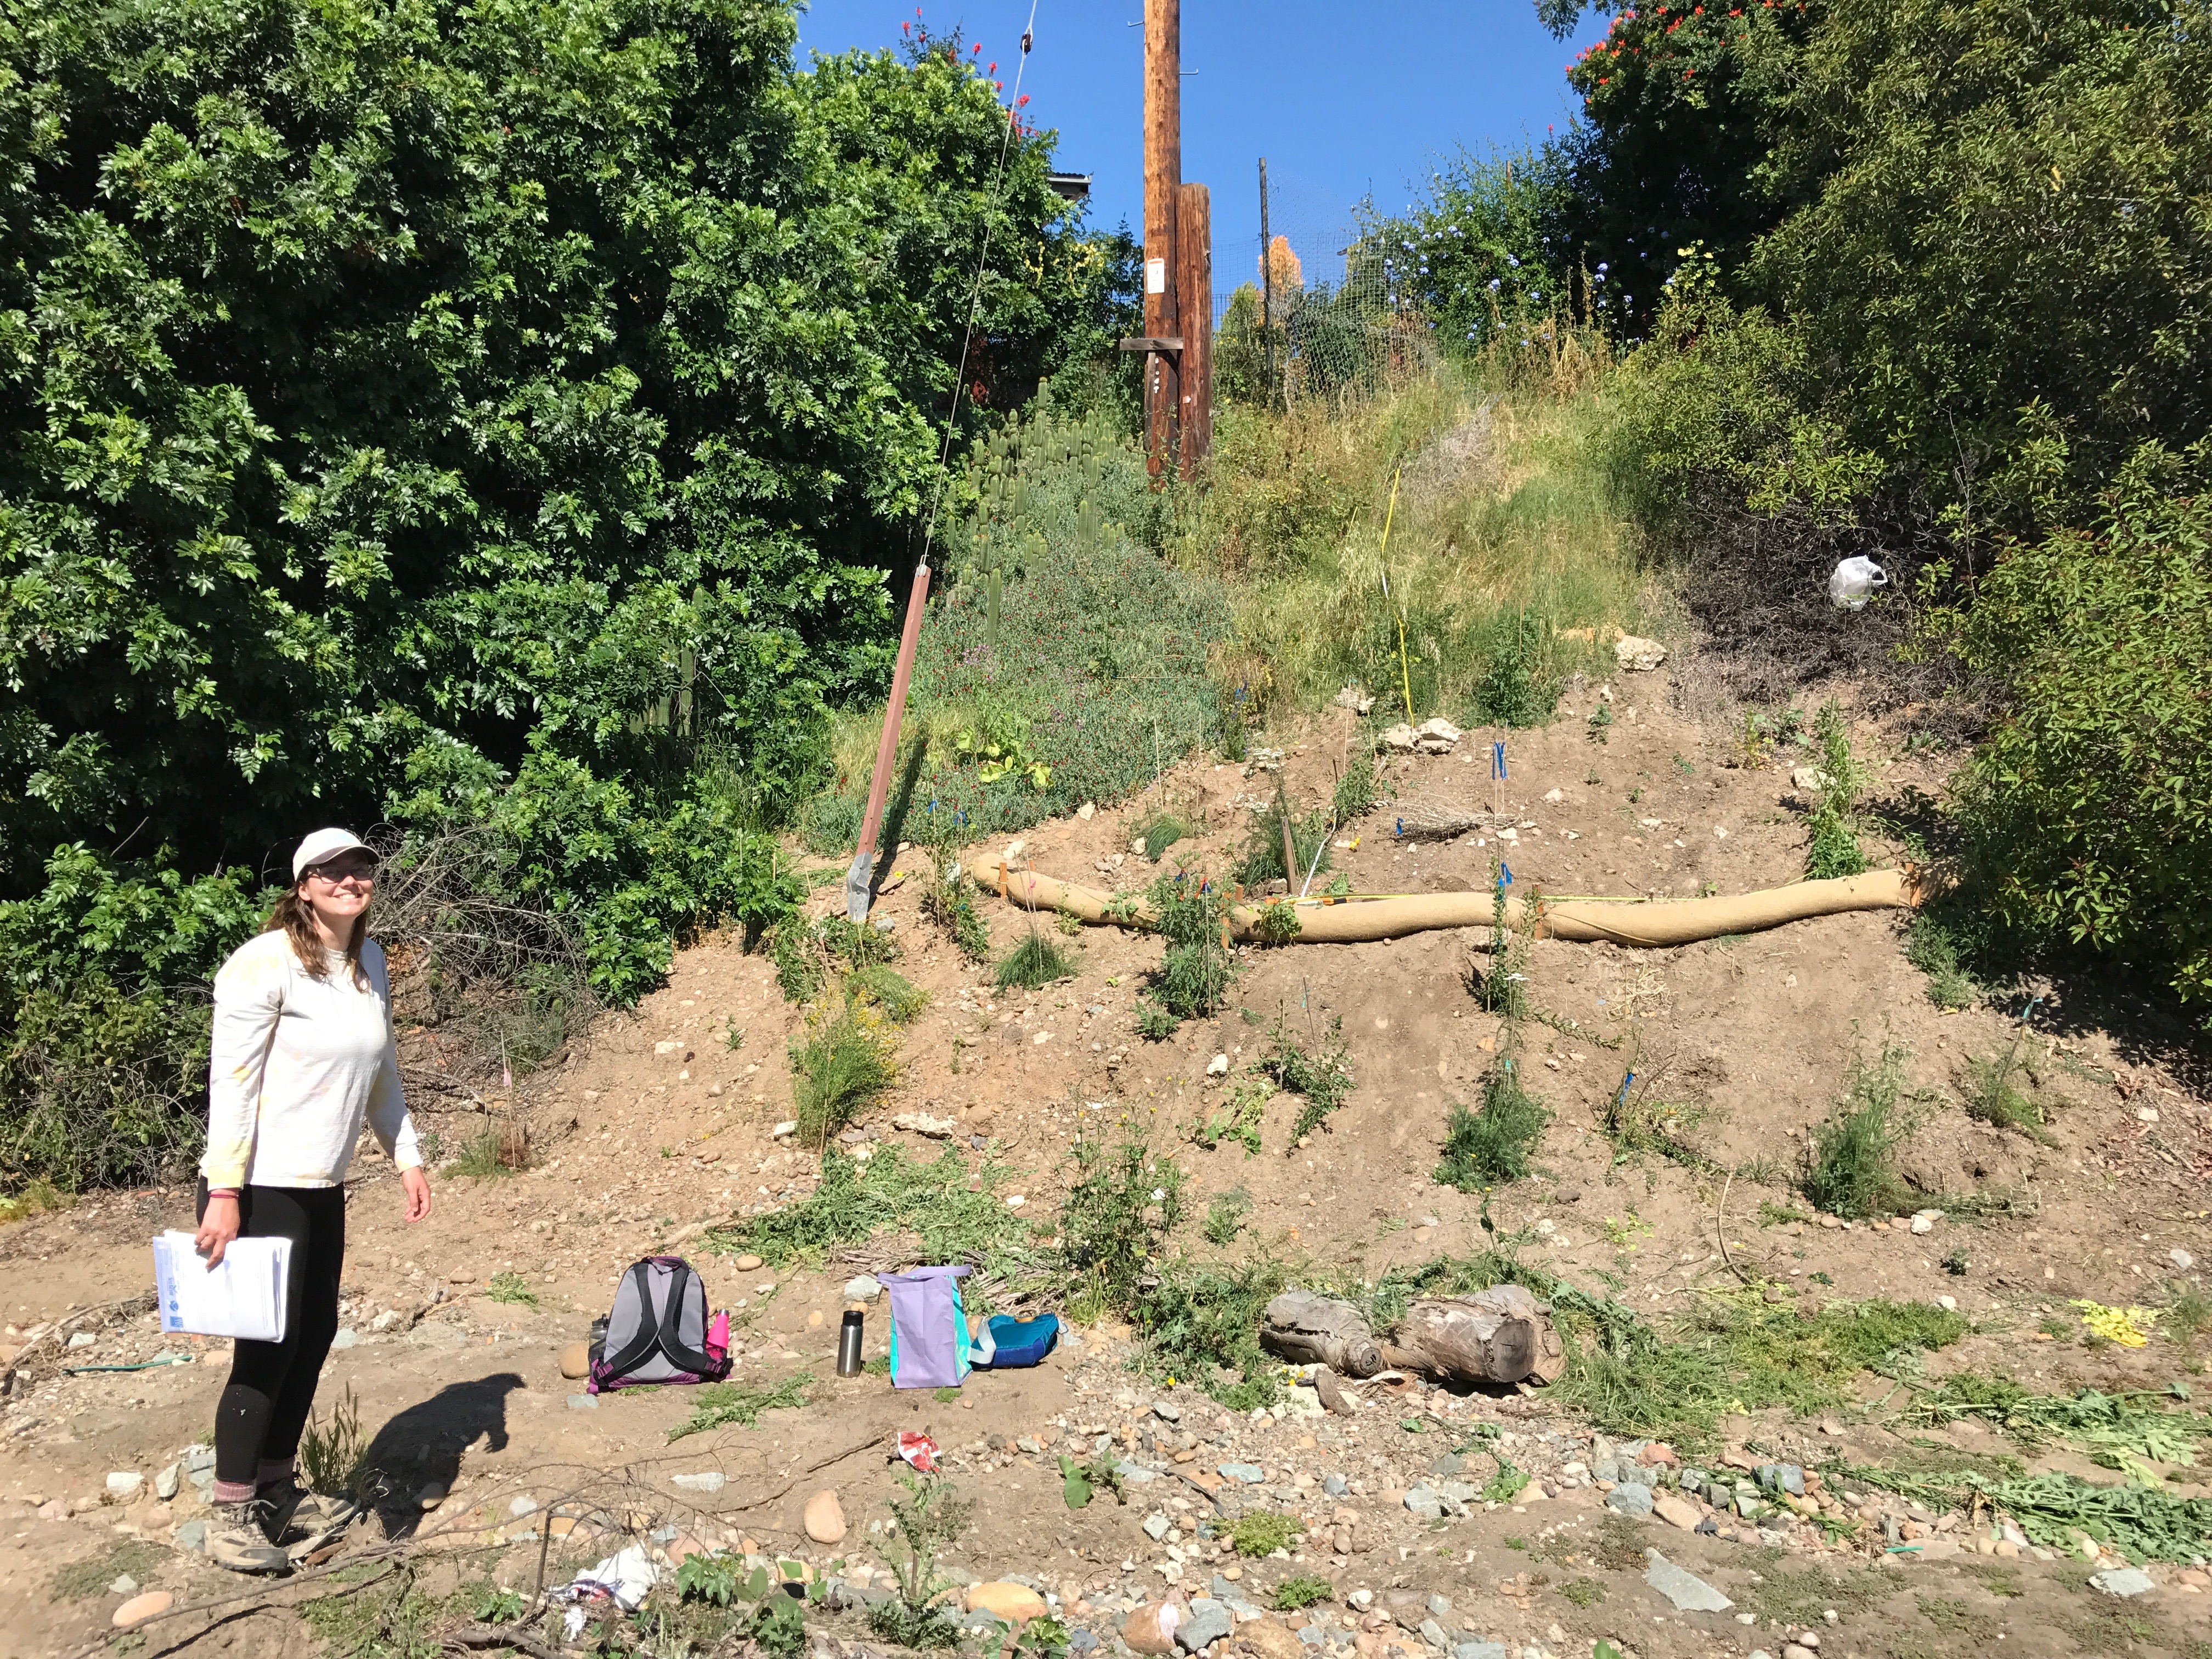
Fig. 5b. The same restoration plot, post planting, in 2018.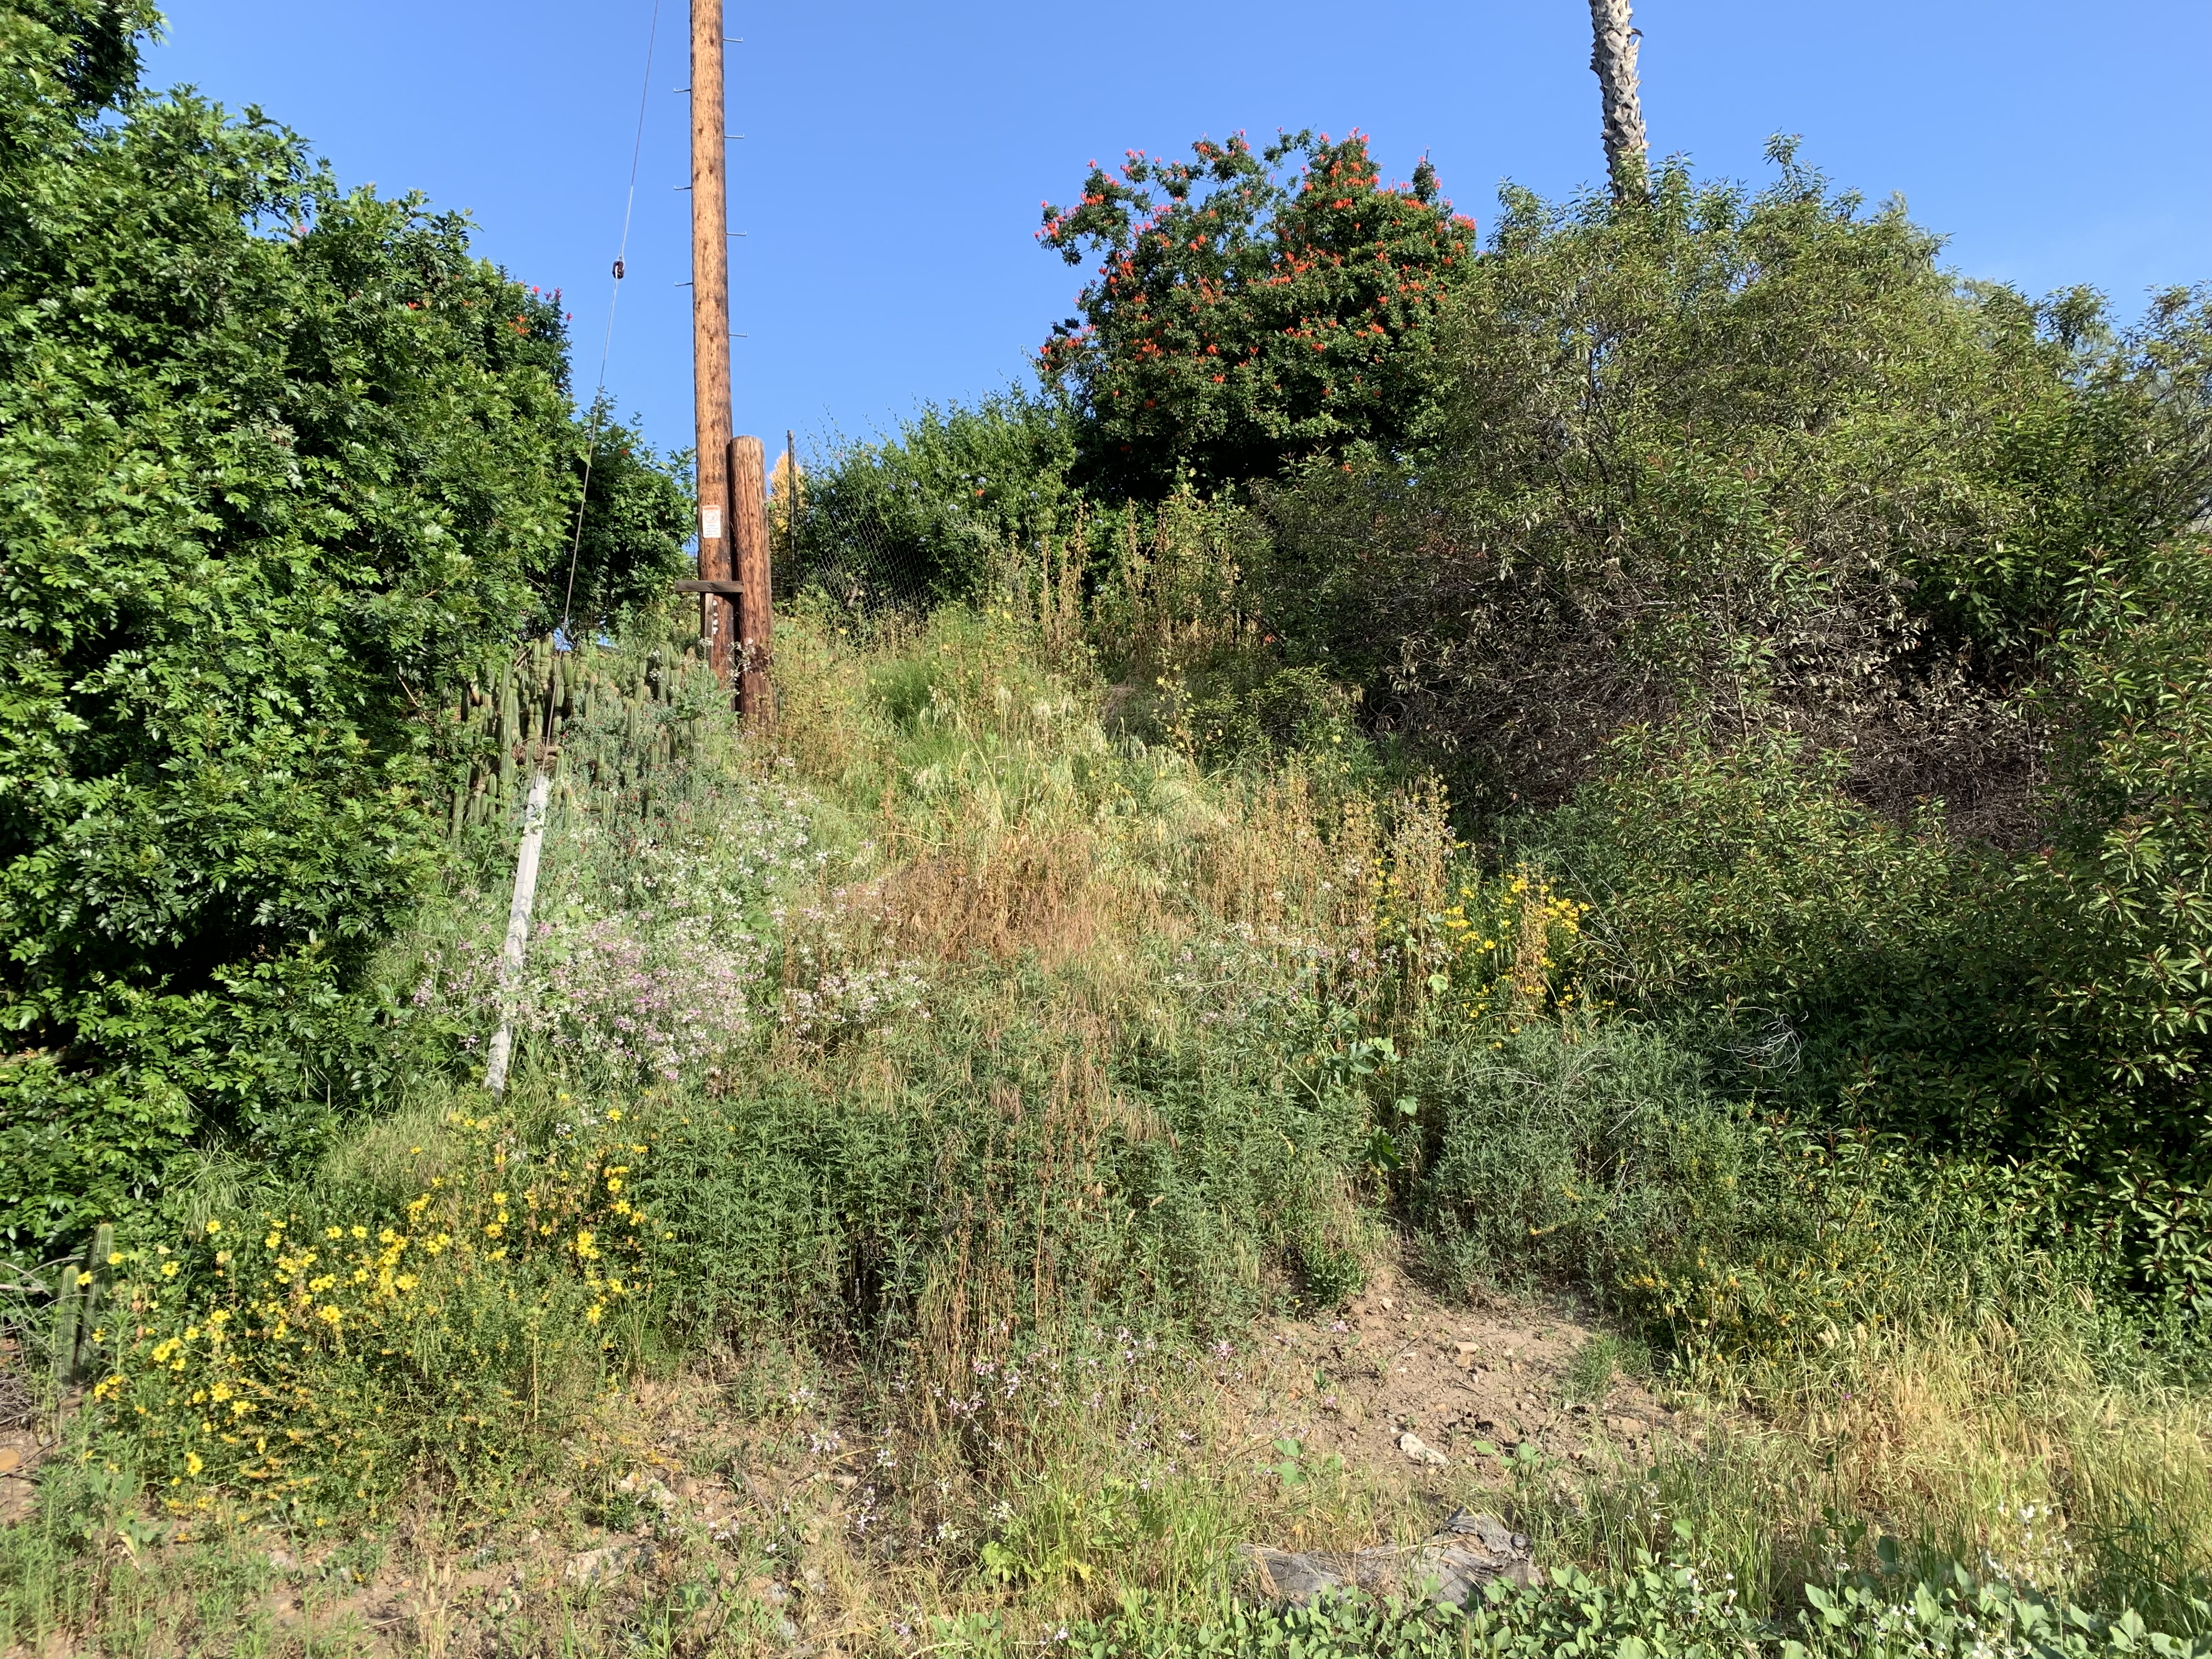
Fig. 5c. The same restoration plot, in 2019. 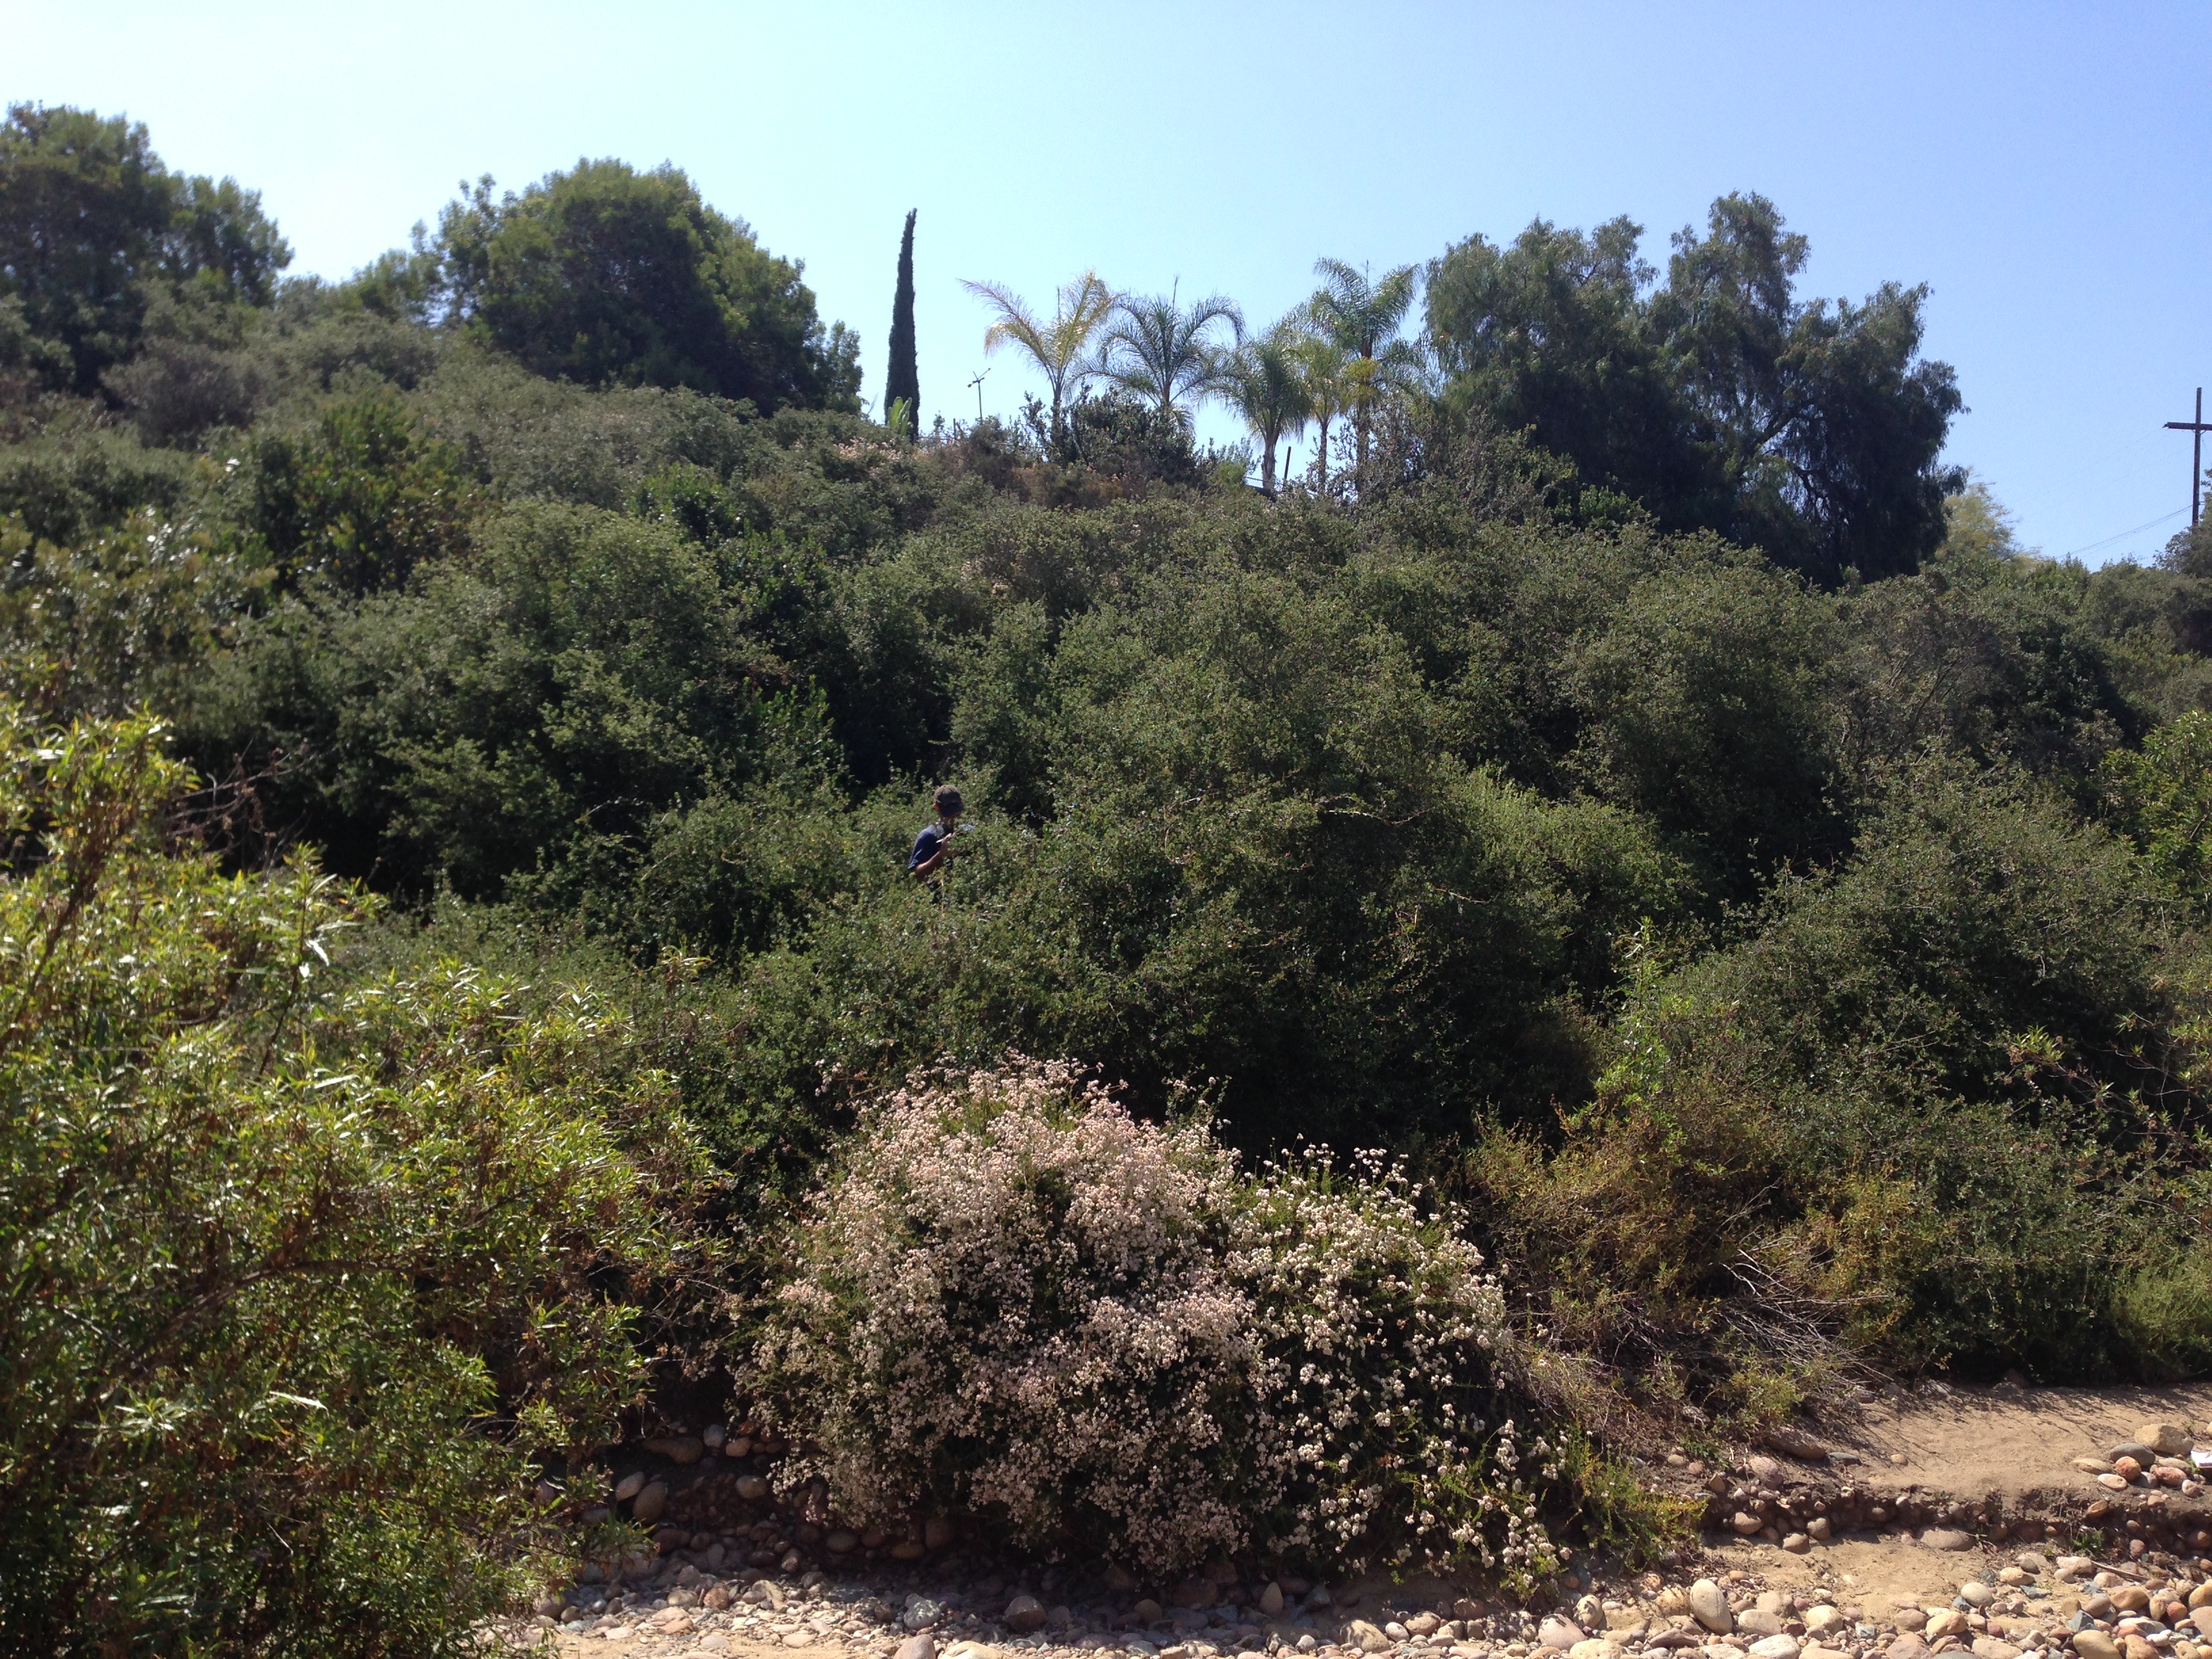
Fig. 5d. The nearby reference plot, in 2017.
